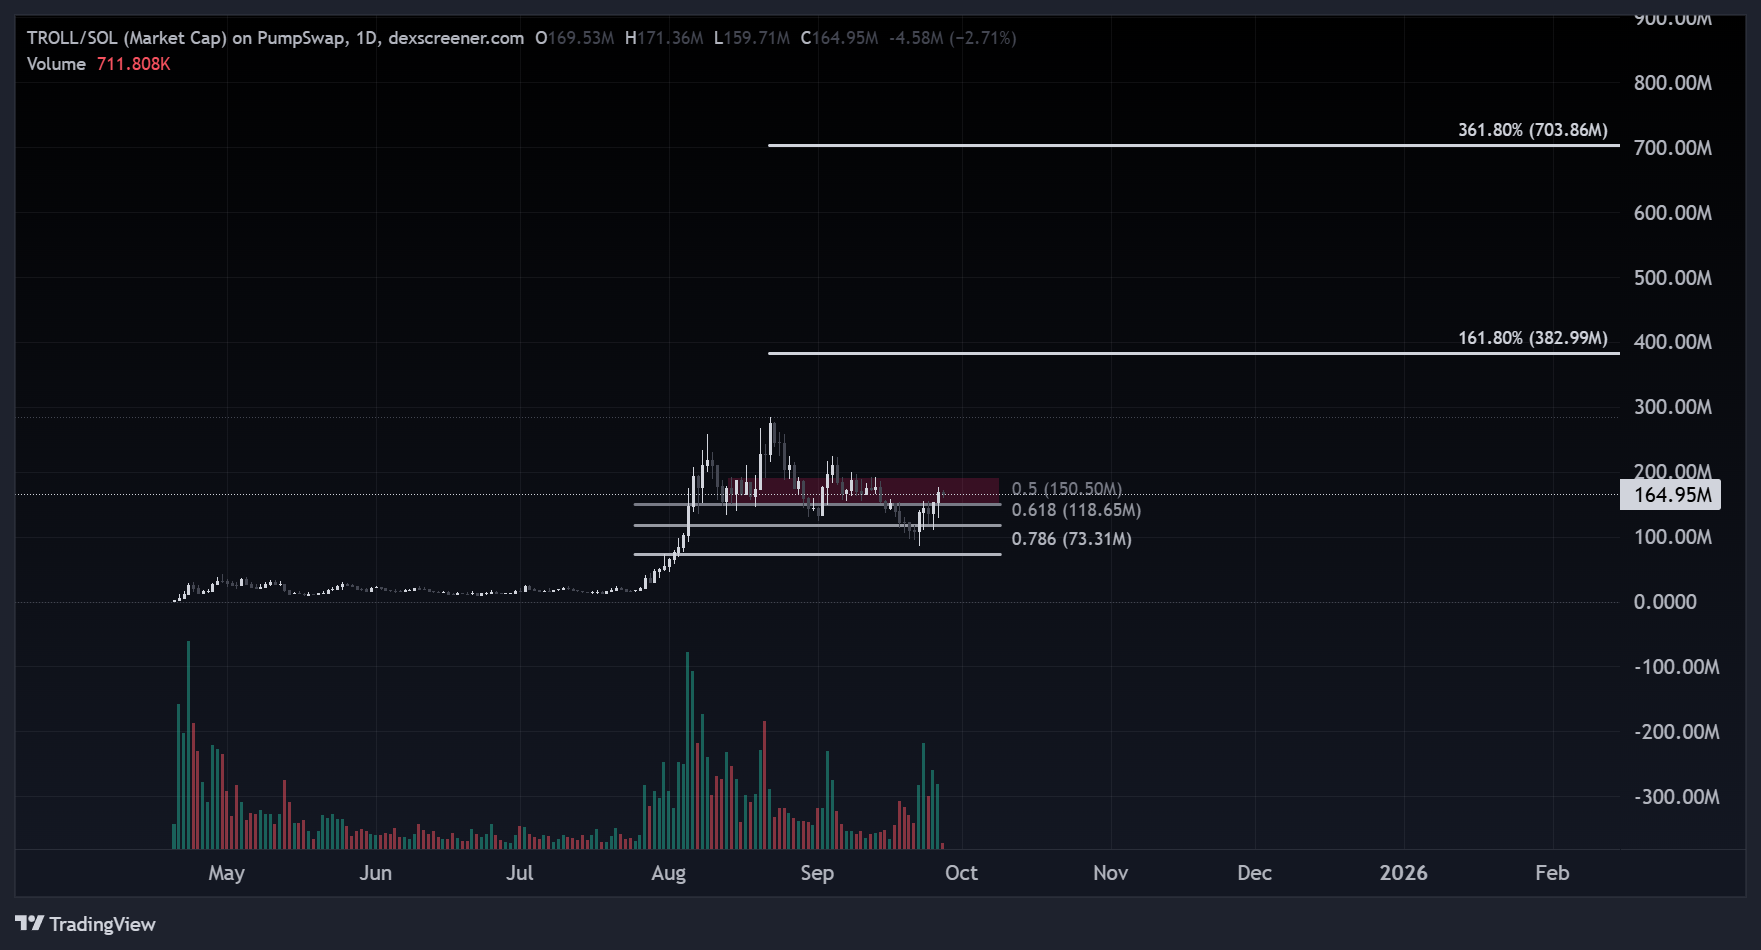
$TROLL Extensions Place Next High Around 400M Copy Copy
$TROLL Extensions Place Next High Around 400M

A Deep Dive into Trends, Patterns, and Fibonacci Projections for the Next All-Time High on $TROLL
Introduction
Overview of Price Action and Trend Analysis
Volume and Momentum Insights
Key Support and Resistance Levels
- Resistance/Extension Targets (Upper Levels):
- 161.80% at $382.99 million
- 381.80% at $703.86 million
- Support/Retracement Levels (Lower Levels):
- 0.5 at $150.50 million (recently tested and held as support during the pullback)
- 0.618 at $118.36 million (golden ratio, often a strong reversal point; acted as interim support)
- 0.786 at $73.31 million (deep retracement; could serve as major support if a deeper correction occurs)
The current price sits just above the 0.5 level, having broken through it during the recent pump, which now flips to support. The 0.618 level aligned with the pullback low, reinforcing its validity. These levels suggest TROLL respected Fib ratios, a common occurrence in trending markets where traders anchor to mathematical symmetries.
Candlestick Patterns and Chart Formations
Zooming in on the October spike, we observe a “three white soldiers” pattern—consecutive candles with increasing bodies—signaling strong bullish continuation. The pullback formed a potential “falling wedge,” a bullish reversal pattern if broken upward, with converging lower highs and lows. Overall, the chart resembles an Elliott Wave structure: Wave 1 (initial pump), Wave 2 (consolidation/dump), Wave 3 (current spike, often the longest), with Wave 4 as the ongoing correction, setting up Wave 5 for new highs.
The “troll” element may refer to the exaggerated volume bars or future timeline, but technically, it doesn’t detract from the bullish setup. A break above $171.36 million would confirm invalidation of the pullback and target higher Fib extensions.
Predicting the Next ATH Using Fibonacci Extensions
Fibonacci extensions are a cornerstone of technical analysis, derived from the Fibonacci sequence (where each number is the sum of the two preceding ones, yielding ratios like 0.618, 1.618, etc.). They project potential price targets by extending the length of a prior move. Typically, for a bullish trend, we measure an impulsive wave (e.g., from swing low to high), then project extensions from the end of the corrective wave.
In this chart, the pre-drawn Fib levels provide a ready framework. The retracement levels (0.5, 0.618, 0.786) appear to map the recent correction from the ATH at $171.36 million down to approximately $73.31 million (aligning with the 0.786 label, a common deep retracement in strong trends). This suggests the pullback respected Fib symmetry, bottoming at a key ratio before reversing.
To forecast the next ATH, we apply extensions to the recent impulsive move—from the major consolidation low (around $73.31 million, the 0.786 support) to the ATH ($171.36 million). The vector length (D) is $171.36M – $73.31M = $98.05 million.Common Fib extensions (projected upward from the low):
- 100% extension: $73.31M + 1.00 * $98.05M = $171.36M (back to recent ATH, already achieved)
- 161.8% extension: $73.31M + 1.618 * $98.05M = $73.31M + $158.72M ≈ $232.03 million (near-term target for continuation)
- 261.8% extension: $73.31M + 2.618 * $98.05M = $73.31M + $256.77M ≈ $330.08 million
- 361.8% extension: $73.31M + 3.618 * $98.05M = $73.31M + $354.82M ≈ $428.13 million
This broader context suggests TROLL could be in a multi-wave bull cycle, with the current spike as an intermediate wave.
Aligning with the chart’s markings, the 161.8% extension at $382.99 million serves as a conservative prediction for the next ATH. This level represents a 1.618 projection of the overall uptrend, a ratio often seen at cycle peaks in meme coins (e.g., similar to DOGE’s 2021 run). Justification: Historical precedents show assets like Solana-based memes frequently hit 1.618 extensions during hype phases, especially with volume confirmation. If momentum sustains and breaks $171M, $383M could be reached by late 2025 or early 2026, implying over 130% upside from current levels.
For a more aggressive target, the 381.8% (3.618) extension at $703.86 million could mark the ultimate cycle top, potentially fueled by viral events or broader market rallies. This would require sustained volume above 1M and no major pullbacks below $118M.
Risks and Conclusion
While the setup is bullish, risks abound: Meme coins like TROLL are prone to rug pulls, regulatory news, or fading hype. A break below $73.31M would invalidate the thesis, signaling a return to consolidation. Traders should monitor volume for confirmation and use stop-losses at key Fib supports.
In summary, TROLL’s chart paints a picture of resilience and potential explosive growth. Leveraging the Fibonacci extensions as marked, the next ATH is projected at $383 million (161.8% level), with an upside stretch to $704 million. As always, this is speculative—trade responsibly in the troll-filled crypto seas.